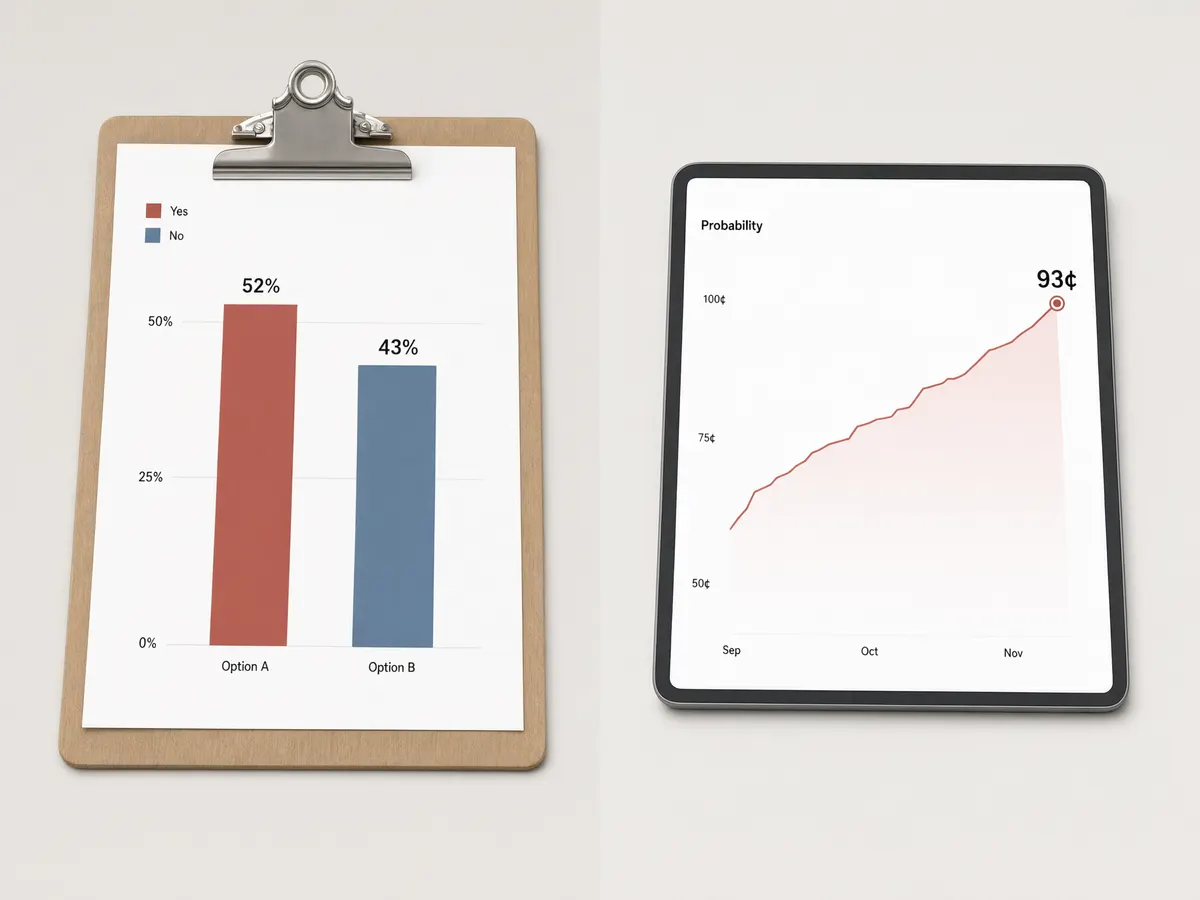
Two numbers have been doing the rounds ahead of November 2026: prediction markets pricing Democratic control of the House at around 93%, and a generic congressional ballot showing Democrats ahead by roughly nine points. They look like two witnesses agreeing. They aren’t. One is a probability, the other is a margin, and the arithmetic that connects them is messier than most headlines admit.
That gap is the whole story of prediction markets vs polls. The debate is usually framed as a contest, as if one method must be the better forecaster. The more useful framing is that they are different instruments measuring different quantities, built from different inputs, and failing in different ways. Once you see that, the question stops being “which one is right?” and becomes “which one tells me what I actually want to know?”
A 93% probability and a 9-point lead are not the same claim
A generic ballot number of D+8.9 is an estimate of a national vote share gap, with a margin of error attached. It says nothing directly about seats. House control depends on how those votes are distributed across 435 districts, how district lines were drawn, incumbency, retirements, and candidate quality in a few dozen competitive seats. A national lead can be real and still convert into fewer seats than the raw margin suggests, or more.
A market price of 93 cents on “Democrats win the House” is a different animal entirely. It is a single number that already bakes in the polling, the seat map, the historical tendency of midterms to punish the party holding the White House, and whatever traders think about events that haven’t happened yet. It compresses all of that into one implied probability.
It also implies something people routinely forget: 93% means the outcome fails to happen roughly one time in fourteen. That is not a rounding error. It is the kind of frequency that shows up in real life often enough to embarrass anyone treating the number as a done deal.
| Opinion polls | Prediction markets | |
|---|---|---|
| What it measures | Stated voting intention in a sample | Price traders will pay for an outcome |
| Output | Vote share / margin, with error bars | Implied probability of a result |
| Update speed | Days, as new fieldwork lands | Continuous, during trading hours |
| Main raw input | Fresh interviews with voters | Polls, models, news, trader judgement |
| Weakest point | Sampling and response bias; slow | Thin volume on low-attention races |
| Who pays | Media outlets, campaigns, universities | Traders, via fees and the spread |
How prediction markets work, stripped to the mechanics
An event contract is a binary instrument. It settles at $1 if the stated event happens and $0 if it doesn’t. So a contract trading at 93 cents carries an implied probability of 93%, because that is the break-even price for a payoff of one dollar. Buy the other side at 7 cents and you are taking the 7% branch.
This is the same logic as converting decimal odds into implied probability, just expressed in cents rather than as 1 ÷ odds. And like any betting market, the venue takes a cut. Exchanges charge trading fees or earn the bid-ask spread, so the yes and no sides of a market rarely sum to exactly 100 cents. That built-in margin, the overround, is why the quoted price is a slightly distorted mirror of what traders genuinely believe, and why short-horizon trading in event contract markets carries a negative expected return before you even get the direction right.
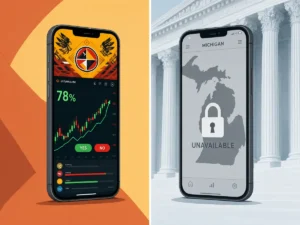
The regulatory layer matters too, and it is the reason political event contracts are suddenly everywhere. Kalshi election markets operate on a federally designated exchange in the United States, which arrived only after a court fight with the Commodity Futures Trading Commission over whether contracts on control of Congress belong on a regulated venue at all. Polymarket built its volume on crypto rails outside that perimeter. The practical consequence for a reader is that “the market says 93%” is an incomplete sentence until you know which market, with what liquidity, and under whose rules. (Current contract listings and regulatory status are worth checking directly with the CFTC rather than taken from a headline.)
The research on political prediction accuracy genuinely splits
Anyone selling you a clean verdict is overselling. The academic record pulls in both directions.
The optimistic case rests largely on the Iowa Electronic Markets, which beat the matching poll in roughly 74% of head-to-head comparisons across five presidential cycles. That track record did more than anything else to make markets respectable as forecasting tools.
The sceptical case is just as serious. A 2012 review by political scientists Robert Erikson and Christopher Wlezien examined decades of election markets and concluded that once scientific polling matured in the 1930s, markets stopped adding predictive value over polls. Their point was partly about circularity: if traders are mostly reading polls and models, a market price is a repackaged poll with a fee attached.
Then there is 2024, the most recent large test. A 2025 analysis led by economist Rajiv Sethi found that Polymarket’s national forecasts for the popular vote and the Electoral College landed about in line with standard statistical models, not meaningfully ahead of them. The same work found markets did considerably worse than models further down the ballot, especially on Congressional races where trading volume and public attention thin out.
That down-ballot weakness is exactly the problem a midterm presents. There is no presidential race to concentrate attention. There are 435 House contests and a third of the Senate, and the outcome hinges on a few dozen seats that almost nobody is trading in size.
Where markets clearly win: speed
The one advantage that holds up without caveats is reaction time. Through 2024, market prices moved within hours of real-time events while polling averages took days to absorb the same information. That is structural, not lucky. A trader can reprice a contract the moment news breaks; a pollster has to field a survey, weight it, and publish.
Speed is not the same as accuracy, though, and it is worth being blunt about that. A market can move fast and move wrong, then move back. During a volatile stretch, a live price is a decent read on what informed people currently believe and a poor read on what will happen in November. Polling averages are slow partly because the underlying measurement is slow, and some of that sluggishness is noise suppression rather than failure.
The exchange you quote changes the number
Here is the finding that should make anyone cautious about citing “the market” as a single authority. Across 2024 election markets, one platform resolved roughly 93% of its contracts correctly while another came in closer to 67%. Same election, same information environment, very different hit rates.
Some of that spread comes down to which markets each venue chose to list, how many were genuinely close calls, and how deep the order books ran. But it demolishes the idea that market prices are a uniform, venue-neutral oracle. Liquidity, contract design, and resolution rules all leak into the number on the screen.
Reading both signals for the 2026 midterms without fooling yourself
For midterm forecasts specifically, a few habits separate a careful reader from a credulous one.
- Treat a probability as a frequency. A 93% line fails about one time in fourteen, and a 67% line fails one time in three. Confident is not certain.
- Never convert a generic ballot margin straight into seats. The seat map, not the national vote, decides control.
- Check the volume behind the price. A chamber-control contract with heavy turnover is a far better signal than a single district market with almost no trading.
- Ask what the market is reading. If the price only moved after a polling average moved, the market is echoing the poll, not improving on it.
- Expect both signals to be noisier down-ballot than at the top of the ticket. That is the clearest empirical finding from 2024.
- Watch the fee and spread. They are small per contract and relentless over many trades, the same way a house edge works in any other wagering market.
The honest conclusion is unsatisfying and correct. Markets are faster, more legible, and better at aggregating scattered information. Polls are the raw measurement that markets largely depend on, and they remain the only instrument that actually asks voters anything. Neither one calls a midterm in advance. They give you a probability and a margin, both of which are statements about uncertainty, not announcements of a result.
One last point, because the regulatory noise around these contracts invites it. Event contracts are speculative financial instruments with real downside, and trading them is not a way to generate income or hedge a political opinion into a profit. If you follow these markets, follow them as a forecasting signal. If you ever trade them, use deposit and loss limits, treat losses as the expected cost, and seek support from a problem-gambling service if the activity stops feeling optional.